


WhiteWater’s Greenhouse Gas Inventory: Measurement & Lessons
| 4 min read
In 2019, we made a commitment to make WhiteWater more sustainable. At the time, we knew we wanted to reduce the environmental impact of our products and services, including setting ambitious net zero goals for our carbon footprint. First, we needed to understand where those emissions were coming from.
Greenhouse Gas Protocol1 defines scope 3 emissions2 under 15 categories. Of these, the following categories are relevant to WhiteWater’s operations:
| GHG protocol category | WhiteWater operations |
| 1. Purchased goods and services | GHG emissions of our suppliers and manufacturing partners |
| 4. Upstream transportation and distribution | Transportation of our products to the project site where our water attractions are constructed. |
| 6. Business Travel | Transportation of employees for work-related activities |
| 7. Employee commuting | Transportation of employees travelling between their homes and the office |
| 11. Use of sold products | Energy used by our sold products |
| 12. End of life treatment of sold products | Waste disposal of decommissioned equipment |
We initially focused our data gathering efforts on our logistics operations. Our attractions are installed around the world, and moving materials across long distances requires complex coordination. We suspected that freight could represent a significant share of our emissions, so we began working with several shipping partners to gather the data needed to estimate our carbon footprint.
We were able to collect information on dollars spent and distance travelled to determine completeness of data and calculate greenhouse gas emissions using emission factors3 from industry averages. While this did not capture every shipment, it provided a meaningful snapshot and allowed us to develop our first estimate of transportation-related emissions.
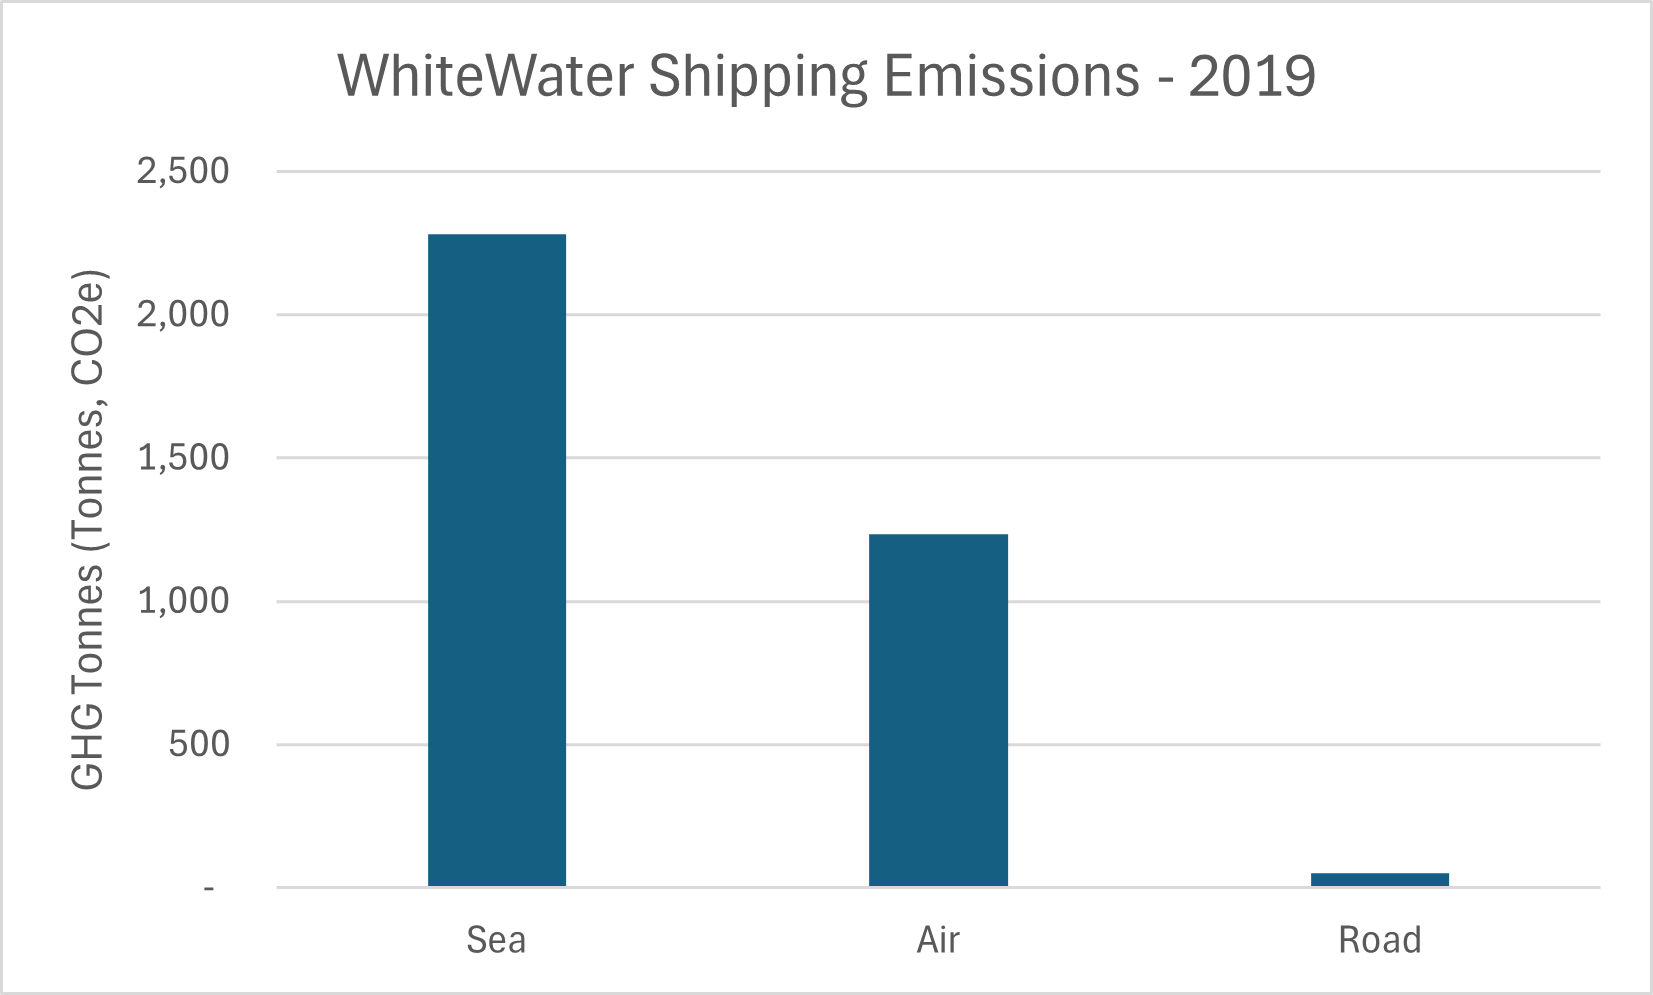
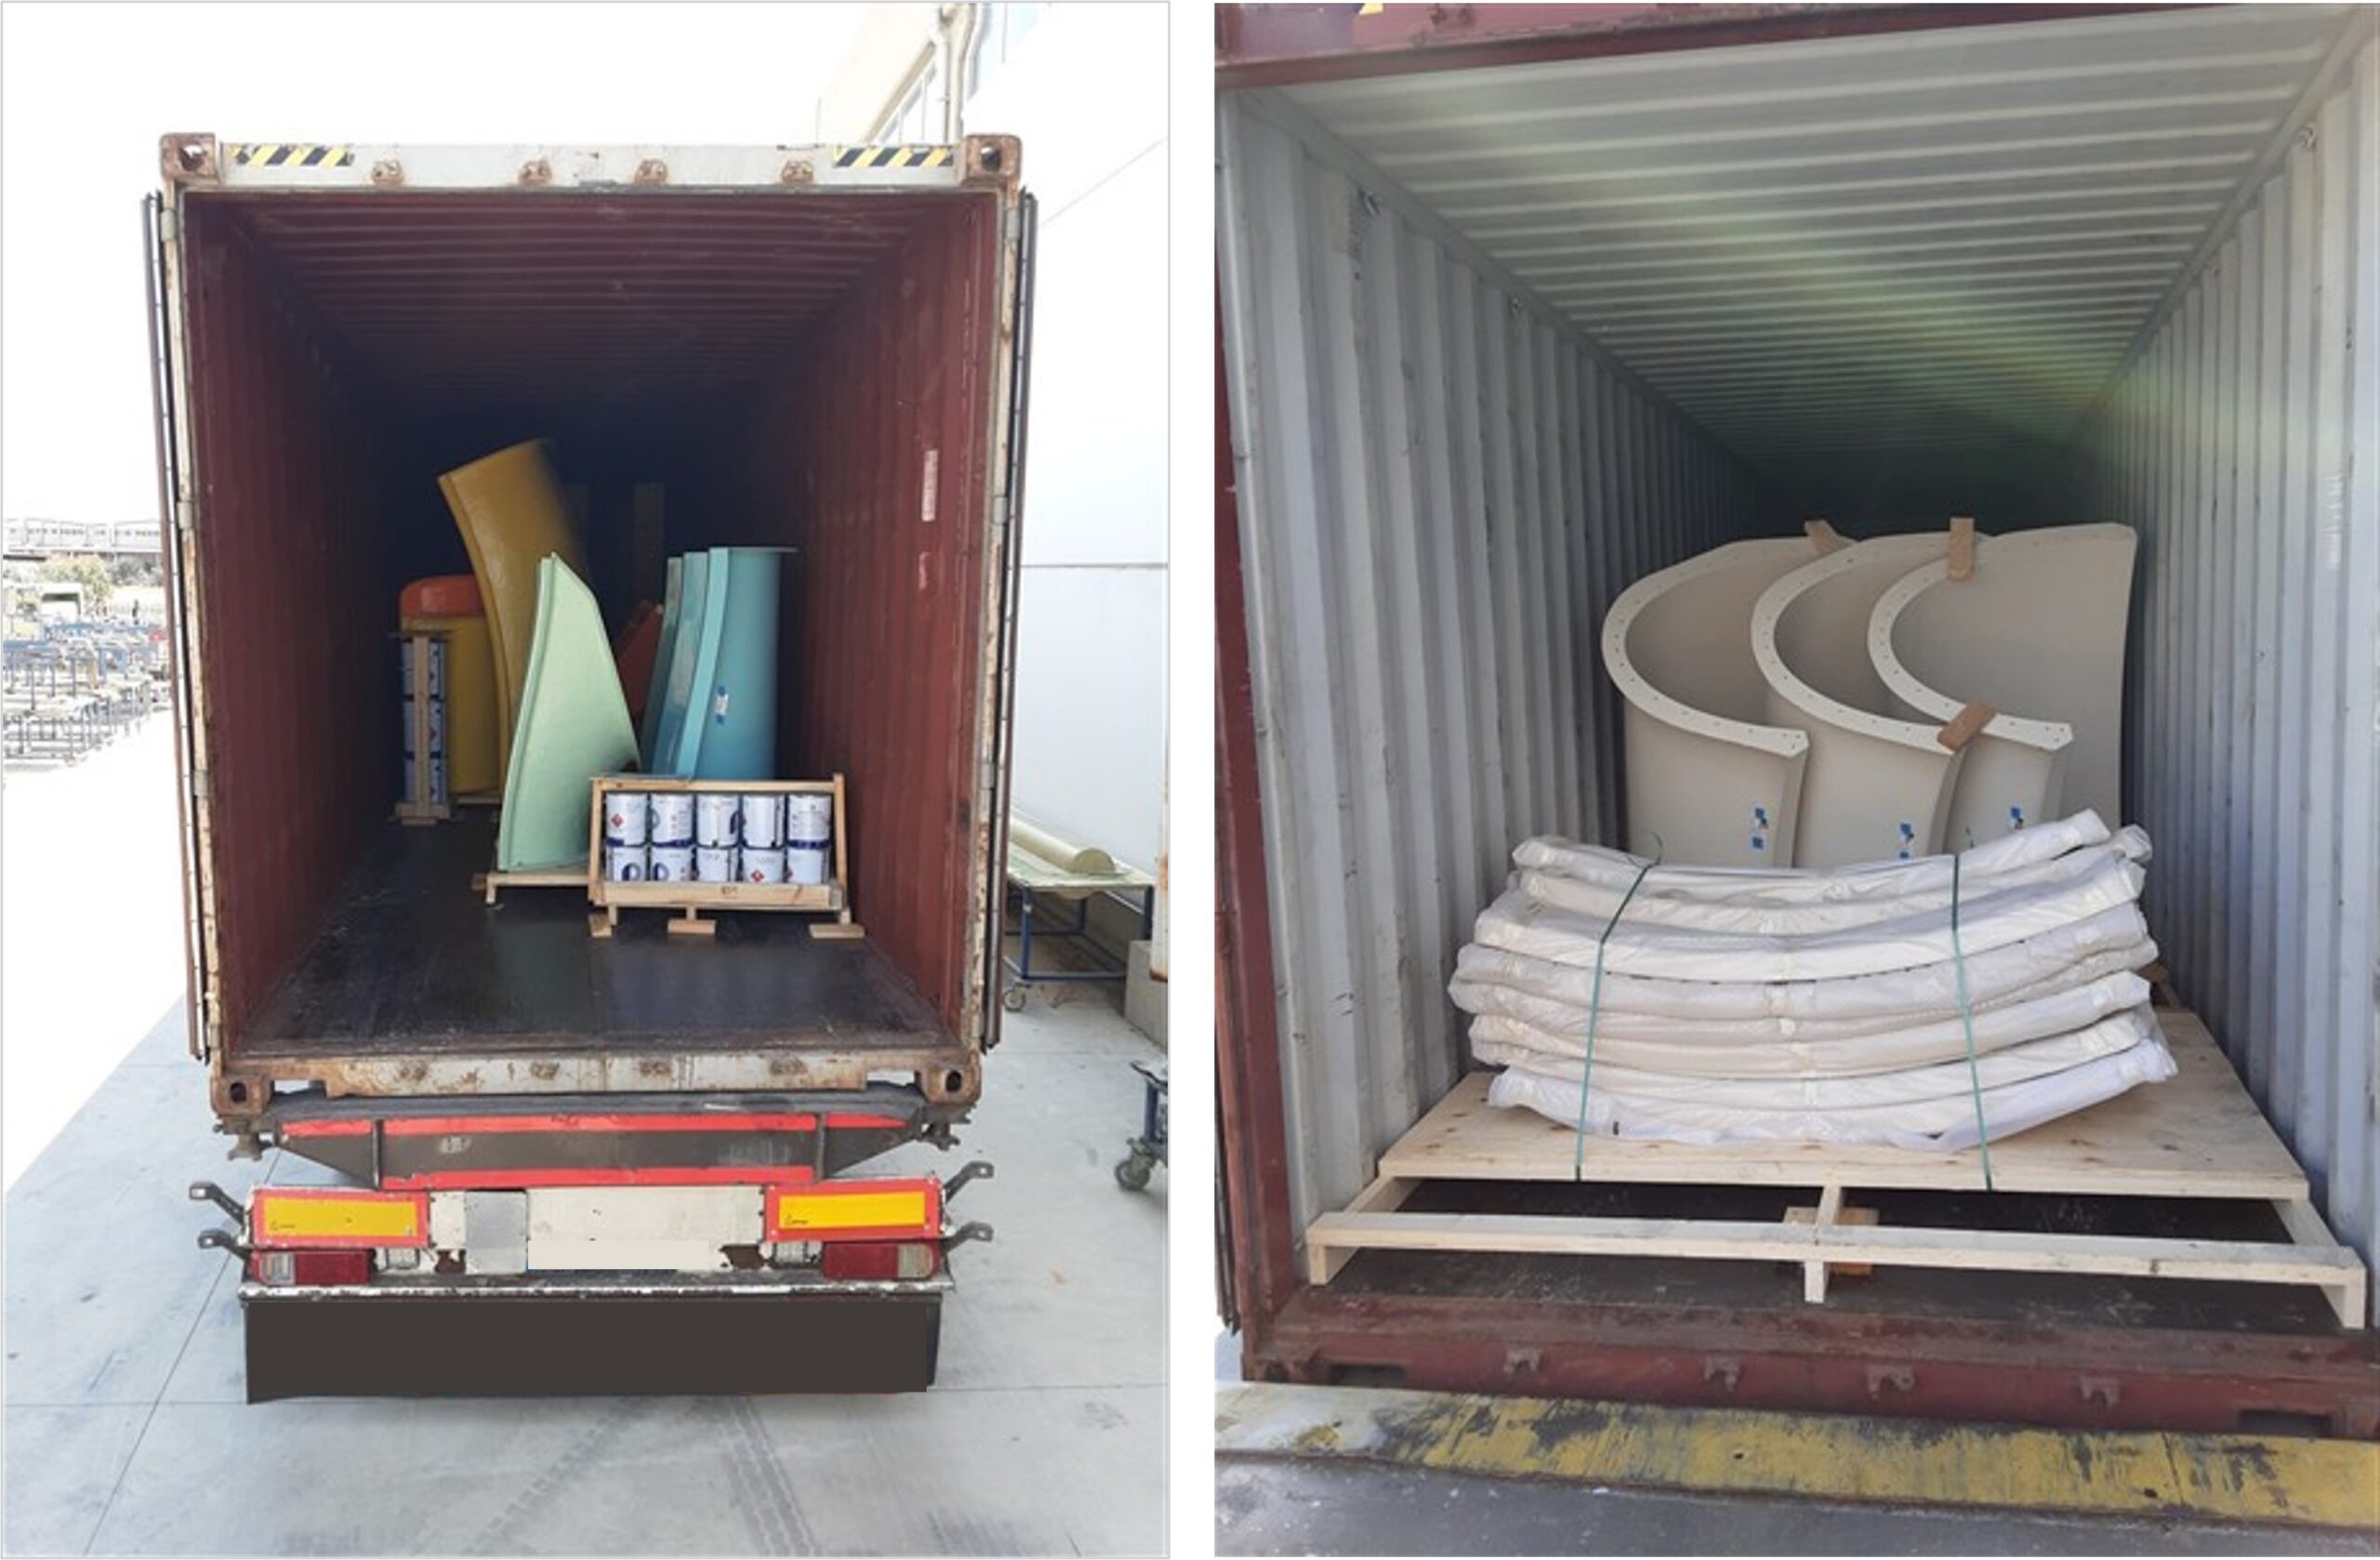
Looking back, this appears to have been an overestimation of our carbon footprint since our shipping behaviors do not resemble those represented by the industry average emission factors. As a water attractions company, we ship a lot of fiberglass all over the world. Fiberglass pieces can be clunky and awkward to ship, but they’re also much lighter than other construction materials like steel. So when we calculate our emissions with activity data4 (weight x distance x emission factor), the actual numbers turn out quite a bit less than what industry averages suggested!
Although this is great news for our shipping impacts, it also means we are reliant on actual data for our calculations. Estimated proxies, such as Environmentally Extended Input-Output factors5 that are commonly used for Scope 3 calculations, don’t reflect the realities of our shipping behaviors and therefore can’t help us close our data gaps.
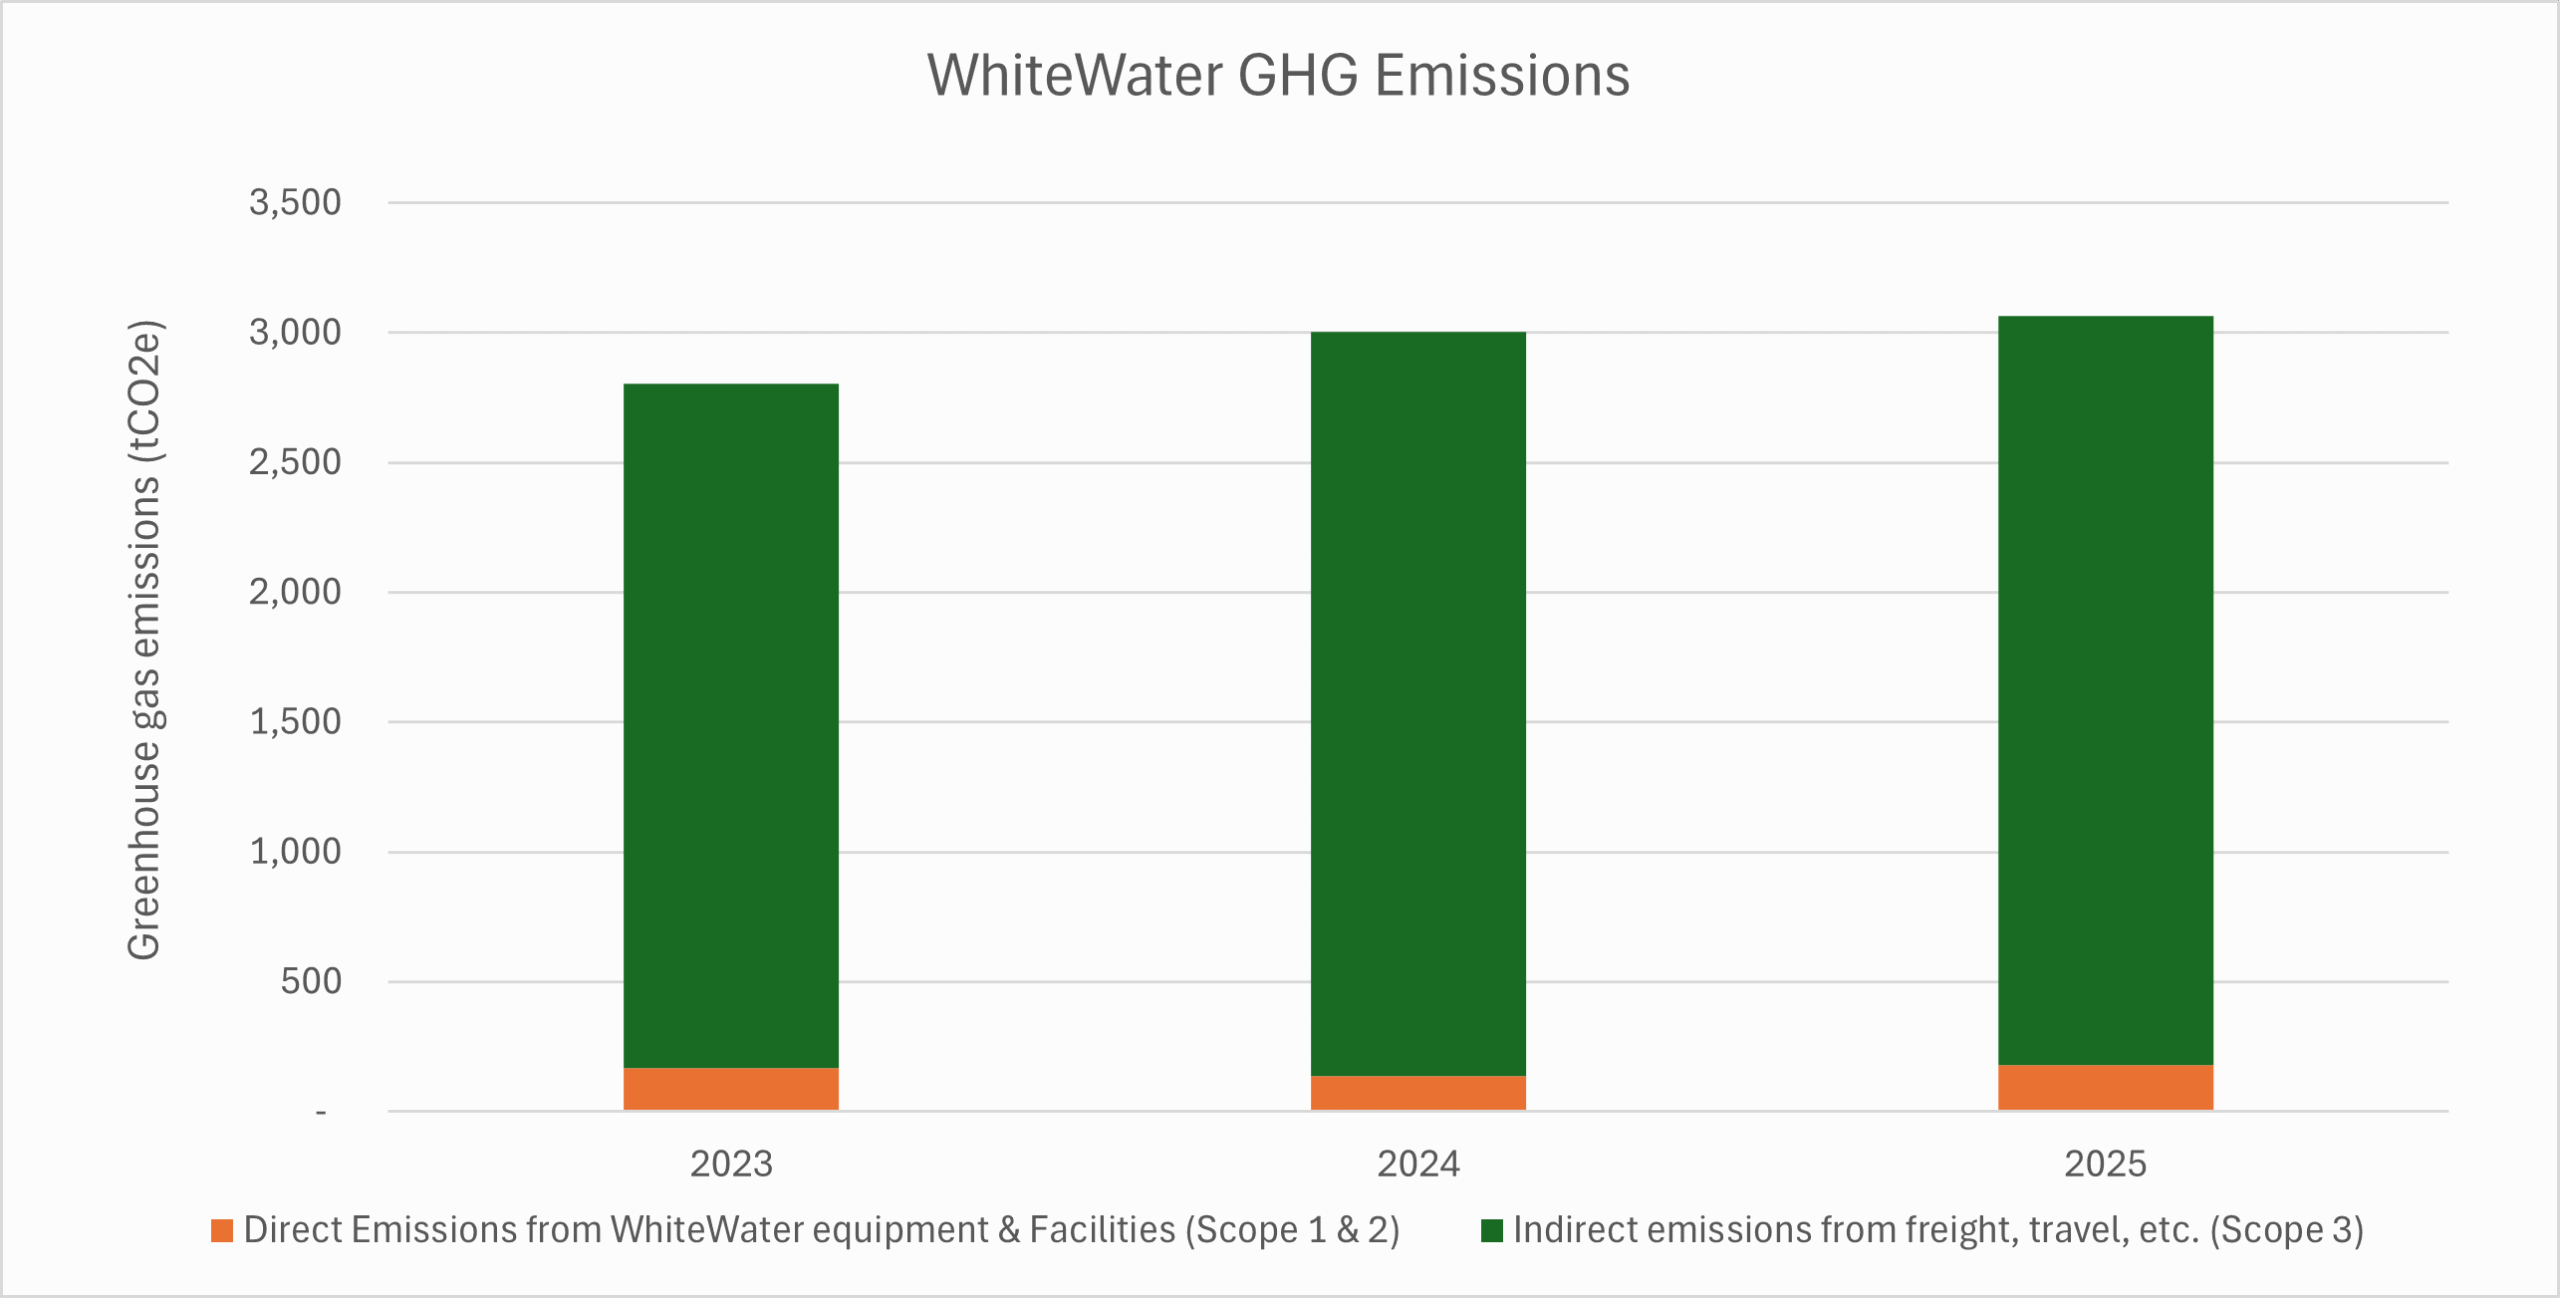
Today, we have updated our GHG calculations to incorporate lessons learned and to align with current best practices. Though we have higher confidence in the data we include in our analysis (quality), it comes at a trade-off to how much we can available for use (quantity).
Today, our dataset represents 58% of our annual logistics spend, a slight drop compared to the 62% from 2019. This is in part due to the increased complexity and growth of our supply chain. We are working with more partners to make more shipments to more destinations around the world. This is our first official baseline, and we know there’s work to do. We are continuing to work with our shipping partners on gathering future data in reliable and efficient ways.
In the meantime, we have also began tracking more GHG emission from our buildings, business travel, and employee commuting.
| GHG Emission source | Data source |
| Buildings and equipment (Scope 1 & 2) | Utility bills for electricity, natural gas, propane |
| Upstream transportation | Logistic partners |
| Business travel (Scope 3) | Corporate travel partners |
| Employee commuting (Scope 3) | Employee survey |
Like most organizations, our GHG inventory remains a work-in-progress as we track down emissions from the other aspects of our business. We are continuing our journey to be a sustainable company, knowing our current emissions help us identify where and how we can reduce them.
Footnotes
1 GHG Protocol is an organization that publishes industry standards, guidance, and resources for measuring and managing greenhouse gas emissions.
2 Scope 3 emissions are indirect greenhouse gases produced in the company’s value chain beyond their control.
3 Emission factors are multipliers published by credible organizations that are used to convert activity data4 (electricity, miles driven, liters of fuel used, etc.) into greenhouse gas emissions.
4 Activity data for greenhouse gas emissions are measured data of a human activity or process that produces emissions. This is multiplied by emission factors to calculate greenhouse gas emissions.
5 Environmentally extended input-out factors are emission factors that are applied to dollars spent on certain activities. These are calculated using complex economic input-output models and environmental data.